Development

Structuring Logs and Traces for AI Agents: What to Record

Antonio Evans11 min read

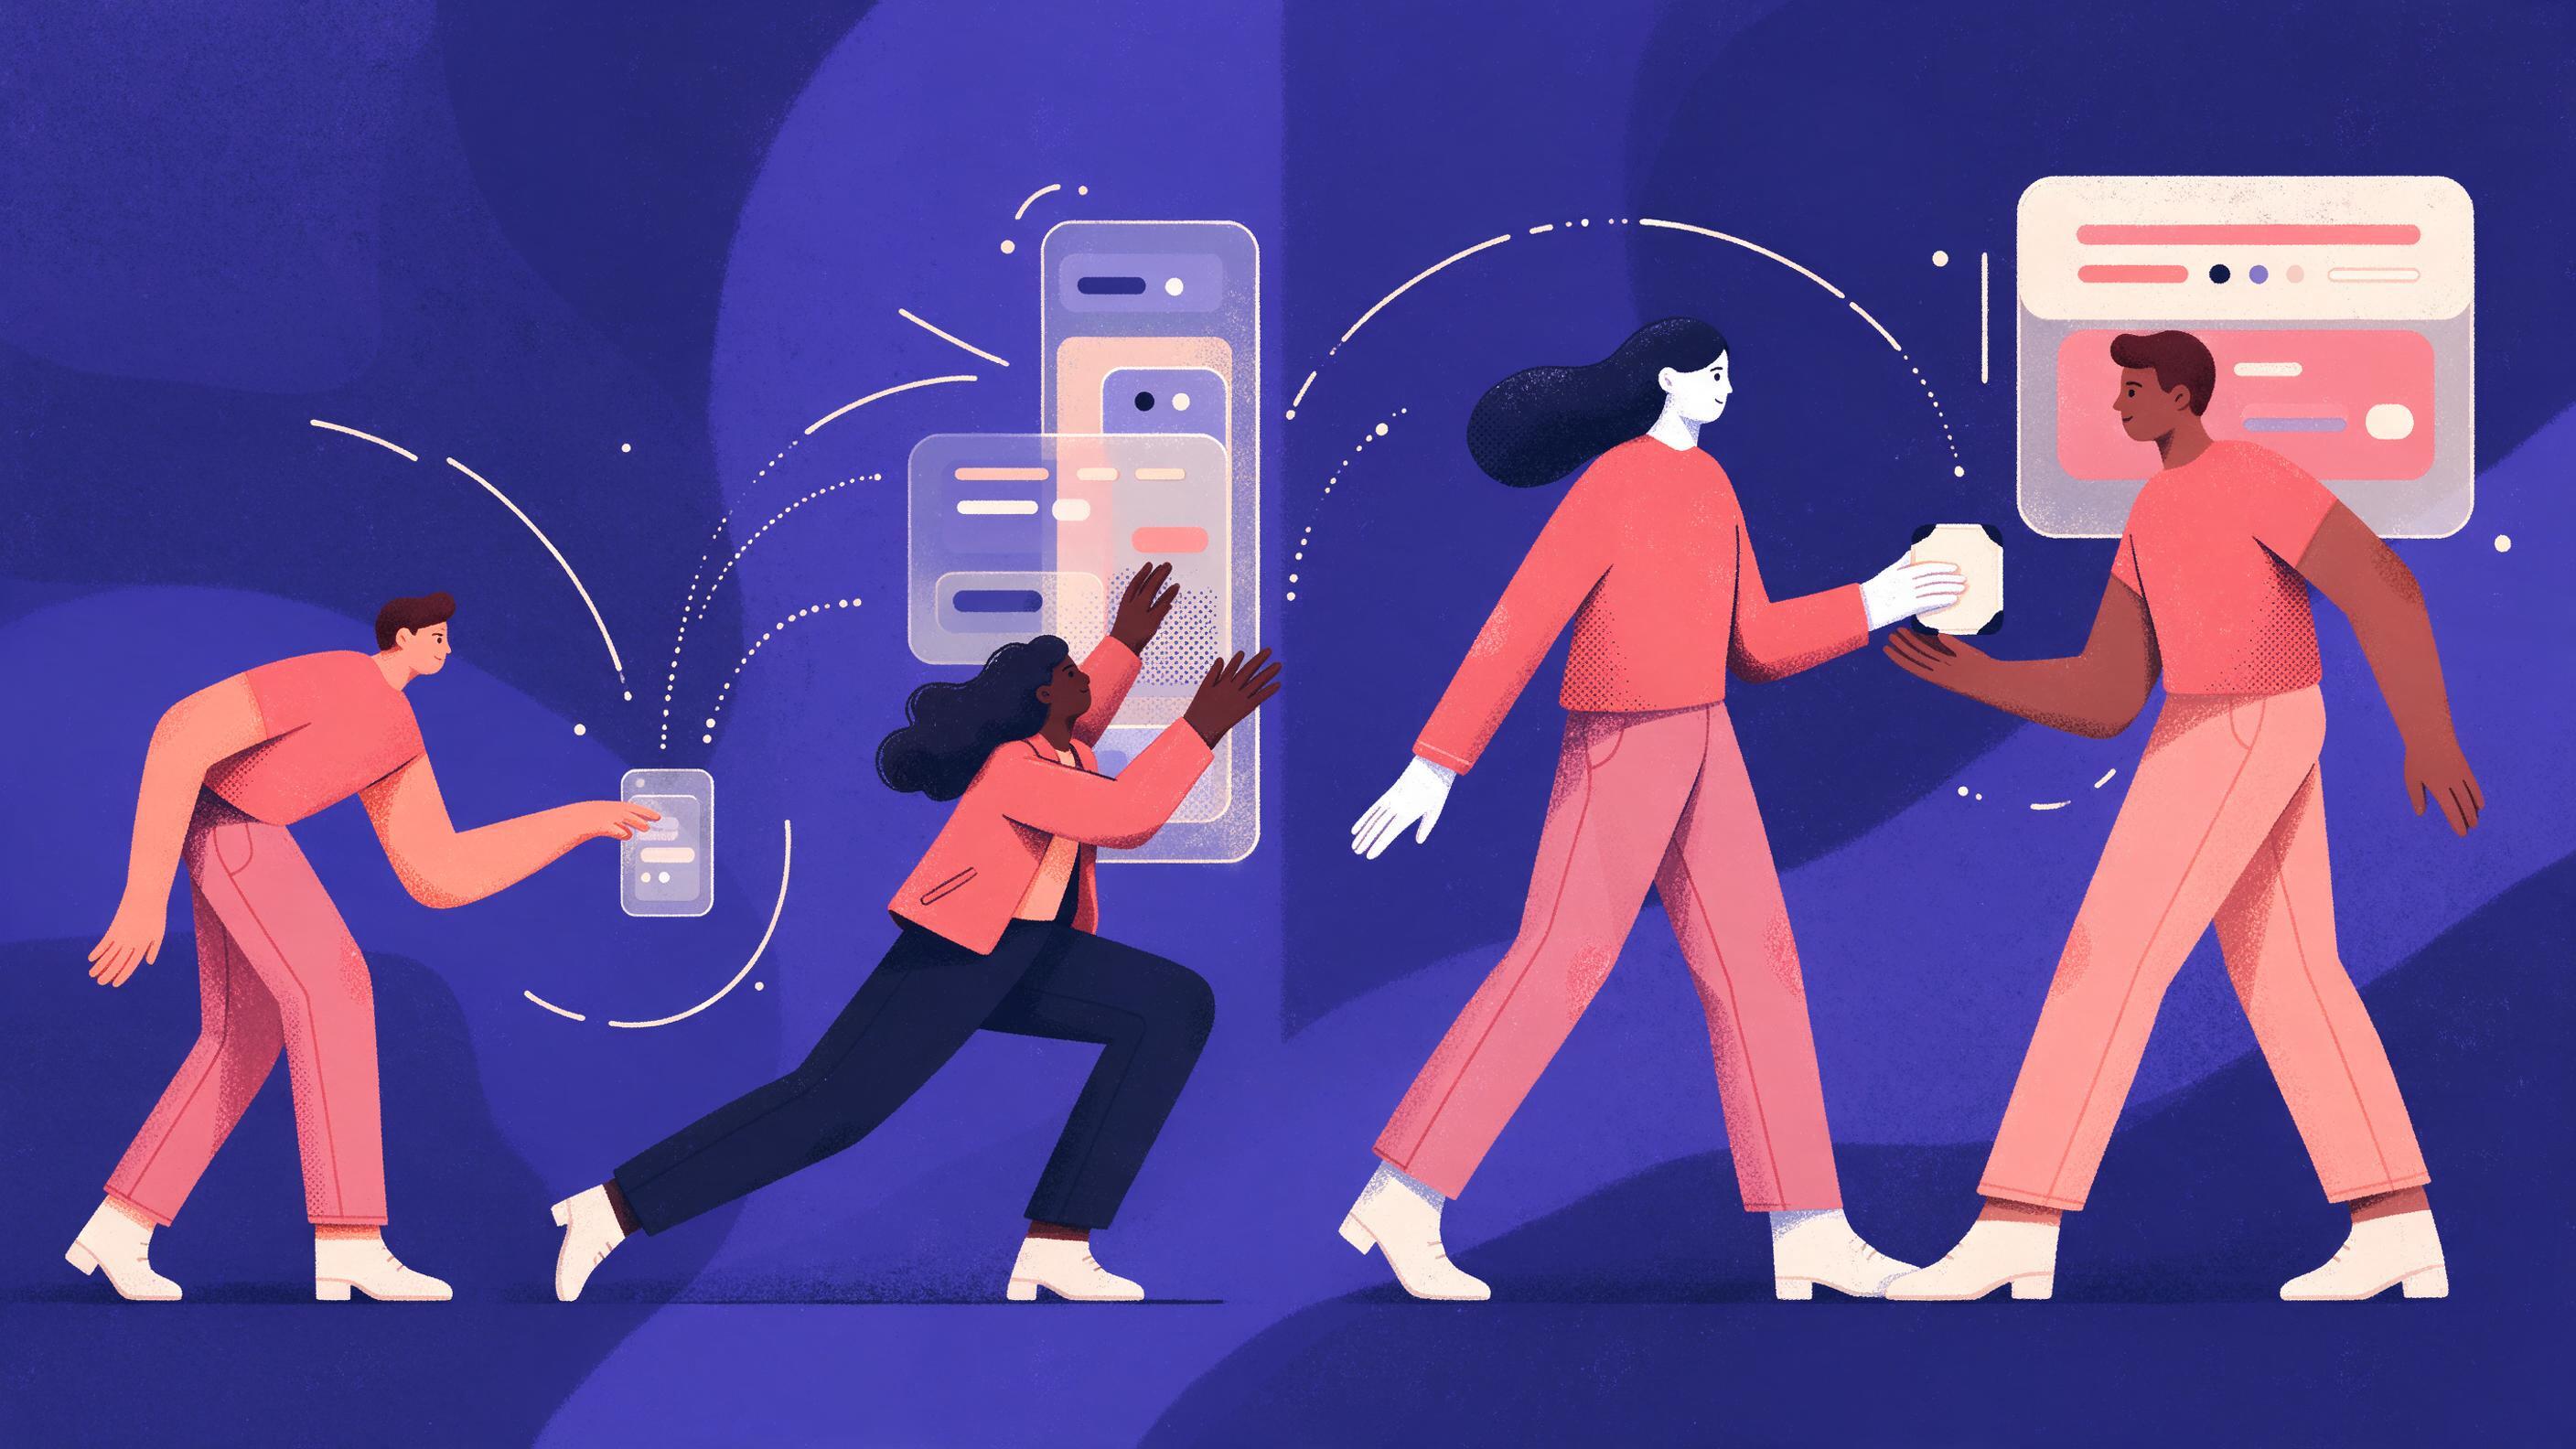
A horizontal flow of three span boxes: tool call, retrieval, handoff.
Key points

Key points

  1. 1Use one trace ID per agent run and one span per step (model turn, tool call, retrieval, handoff) so the whole execution can be replayed in order.
  2. 2For a tool call, record the tool name, the full arguments, the raw result or error, and the duration.
  3. 3For retrieval, record the query, the identifiers of the returned chunks, and their ranking scores.
  4. 4For a handoff, record the reason, a short summary of the conversation so far, and the target queue or person.

Why agent runs need traces, not just logs

A log line is a standalone event. It carries a timestamp and a message, but nothing that ties it to the retrieval step, the model turn, and the tool call that together produced one answer. When several users hit an agent at once, entries from different runs interleave in the same stream and the failing run becomes hard to reconstruct by hand. Traces exist precisely to preserve those relationships: a span represents one unit of work, and parent and child spans mirror how the code executed, so a reader can follow one request from start to finish with every step in context Braintrust.

The OpenTelemetry primer draws the same distinction. Logs "aren't enough for tracking code execution, as they usually lack contextual information, such as where they were called from," and they become far more useful when included inside a span or correlated with a trace and span ID the observability primer. That is the whole argument for applying request tracing to agent runs: the interesting questions ("why did it pick that tool?", "which document did it cite?") are relational, not point-in-time.

Agents make the problem worse than ordinary microservices because the same input can take a different path on the next run. The model can choose a different tool, retrieval can return a different set of documents, and a single request can span multiple model calls before returning an answer Braintrust. A trace is the only artifact that captures which path was taken.

There is a practical reason to build on OpenTelemetry specifically. It is an open source, vendor-neutral framework, so instrumentation is written once and exported to any backend without touching application code when the backend changes what is OpenTelemetry. Semantic conventions supply standard key names for common operations, which is what stops one team logging userId and another user_id OpenTelemetry overview.

The remaining design work is deciding what goes on each span. This article gives the field list per step, the size and privacy decisions that go with it, and the sampling rule that keeps the cost sane.

The trace skeleton: one run, four span types

Model the run as a tree with a single root and a small, fixed set of child span types. The root span covers the whole run and carries the conversation identity. Under it, four kinds of child span:

  • Model turn (chat): one call to the model, including planner steps, tool-selection turns and the final synthesis.
  • Tool call (execute_tool): one invocation of an external function, API or database.
  • Retrieval (retrieval): a search against a vector store, index or document corpus.
  • Handoff: transfer of the run to a human queue or another agent.

Honeycomb's agent instrumentation guidance names three attributes every span in the chain needs so that multiple traces and multiple agents can be grouped into one conversation view: gen_ai.conversation.id to bind spans together, gen_ai.agent.name to identify which agent emitted the span, and gen_ai.operation.name to record the kind of operation, with values including chat, execute_tool, invoke_agent, retrieval and embeddings Honeycomb. Their point about scope matters: a "GenAI span" is not only an LLM call, it is any span anywhere in the execution chain triggered by the agent, including downstream database queries and third-party API calls, because the root cause is often not the model Honeycomb.

A worked rule of thumb for span count: a support agent that plans, retrieves, calls two tools and writes a final answer produces roughly one root span, two model turns (plan and answer), one retrieval span and two tool spans, six spans in total. A research agent that loops five times before answering produces far more, and the loop count is itself the first number you want to chart.

Use the standard GenAI attributes where they fit rather than inventing names. The conventions define attributes such as gen_ai.request.model, gen_ai.usage.input_tokens, gen_ai.usage.output_tokens and gen_ai.response.finish_reasons, which record the model used, the token counts per call, and why the model stopped generating OpenTelemetry GenAI observability. Those are free with most modern instrumentation and answer the cost and truncation questions before you write a line of custom code.

Tool call spans: arguments, result, error, duration

A tool call span without its arguments is nearly useless. When a payment agent refunds the wrong order, the question is not "did it call refund_order?" but "what order ID did it pass?" Record the tool name in the span name (the conventions require the tool name in execute_tool span naming), the full argument object, the raw result or error, and the wall-clock duration.

FieldTypeWhy it earns its place
tool.namestringGroups failures and latency by tool
tool.call.idstringJoins the request to the response when calls are concurrent
tool.argumentsJSON objectShows what the model actually asked for
tool.result.statusenum (ok, error, timeout)Lets you compute a success rate per tool
tool.result.bodyJSON, truncatedThe raw payload the model then reasoned over
tool.error.type and .messagestringSeparates validation errors from network errors
duration_msnumberDistinguishes slow tools from slow models
tool.retry.countnumberExposes retry storms before they become outages

Two details are easy to get wrong. First, record the arguments as the model emitted them, not as your code normalized them, otherwise you cannot tell whether a failure came from the model or from your adapter. Second, log the error and still close the span: a span that is never ended shows up as missing rather than failed, which corrupts your error rate.

On size, tool results can be enormous (a full page of HTML, a thousand-row query result). Store a truncated body in the span attribute and the full payload in object storage keyed by the span ID. The GenAI conventions note that prompt and tool content attributes can be large and that many observability platforms render them as raw JSON, so some tools ship a dedicated viewer for them instead OpenTelemetry GenAI observability. That is a signal to keep payloads lean by default and opt in to full capture where you need it.

A minimal structured record for a tool span, in the shape most JSON loggers accept:

{
  "trace_id": "4bf92f3577b34da6a3ce929d0e0e4736",
  "span_id": "00f067aa0ba902b7",
  "name": "execute_tool refund_order",
  "attributes": {
    "gen_ai.conversation.id": "conv_8831",
    "gen_ai.agent.name": "billing-agent",
    "gen_ai.operation.name": "execute_tool",
    "tool.name": "refund_order",
    "tool.arguments": {"order_id": "9981", "amount_usd": 149.99},
    "tool.result.status": "ok",
    "tool.result.body": {"refund_id": "re_5521", "eta_days": 3},
    "tool.retry.count": 0
  },
  "duration_ms": 412
}

The trace_id and span_id fields are what let a log line be joined to its trace later. Structured logs that carry these identifiers are queryable as columns rather than needing regex to find a request ID inside a sentence SigNoz. That is the cheapest single upgrade most agent teams can make.

Retrieval spans: query, chunk identifiers, scores

Retrieval is where agents most often go wrong and where traces most often go blind. If the agent answered from the wrong document, you need to know which query ran, what came back, in what order, and with what scores.

Record on the retrieval span:

  • The query text as sent to the index, plus any rewritten or expanded queries if the agent runs query rewriting.
  • The index or collection name and any filters applied (tenant, date range, permissions).
  • For each returned chunk: a stable chunk ID, the source document ID, the rank position, and the relevance score.
  • The number of candidates retrieved before and after any reranking.
  • The embedding model used, if the query was embedded.

Storing chunk IDs rather than chunk text keeps spans small and lets you rehydrate the exact content later using the ID. If you must store text, store the top three chunks and the count of the rest. A retrieval span that records the query and the IDs but no scores cannot answer the most common postmortem question: did the right document exist in the results but rank eighth, or was it never retrieved at all?

The GenAI semantic conventions now include a dedicated retrieval span alongside cache token attributes, which is a sign the community treats retrieval as a first-class step rather than an implementation detail of the model call Greptime. Aligning your field names to that span shape costs nothing now and saves a migration later.

Distance measures complicate score interpretation: some stores return similarity where higher is better, others return distance where lower is better. Record the metric name in an attribute (for example retrieval.score.metric set to cosine_similarity or l2_distance) so an on-call engineer does not invert a threshold at 3am.

Human handoff spans: reason, summary, assignee

A handoff is a decision, and decisions deserve a record. When an agent escalates to a person, log three things on a dedicated span: the reason the agent could not proceed, a short summary of the conversation so far, and the target queue or person it routed to. Add the run outcome (resolved_by_agent, resolved_by_human, abandoned) so you can later compute containment rate.

The reason field should be an enum, not free text, with values you choose deliberately: low_confidence, policy_blocked, tool_failure, user_requested, out_of_scope, sensitive_topic. Free-text reasons cannot be grouped. An enum lets you chart handoffs by reason and discover, for instance, that most escalations come from one tool timing out during peak hours.

The summary is the hardest field to get right. It needs to be short enough to read in a queue and specific enough that the human does not have to open the trace. A useful shape is: the user's original request, what the agent already did (tools called and their outcomes), what is blocking, and what the agent recommends. Cap it at a few hundred words and store it on the span, because it doubles as the handoff payload.

Include the assignee or queue identifier and the time to first human response where you can capture it. The handoff span is the seam between your automated metrics and your human support metrics, and it is the only place where you can measure the true cost of an agent failure.

Size, privacy and the content capture decision

The biggest operational mistake in agent tracing is capturing everything by default. Prompts, tool arguments and results routinely contain personal data, credentials in URLs, and proprietary documents. The GenAI conventions handle this deliberately: by default no prompt content or tool arguments are captured, only metadata such as model names, token counts and durations, and enabling content capture populates span attributes with full prompt messages, system prompts, tool schemas, tool arguments and tool results OpenTelemetry GenAI observability.

Adopt that default as a decision rule rather than a toggle you flip globally:

Content classDefaultWhen to opt in
Model name, token counts, finish reasonAlways onNever off
Tool name, status, duration, retry countAlways onNever off
Tool arguments and resultsOff or truncatedStaging, or sampled production with redaction
Full prompts and completionsOffDebugging specific runs by ID, short retention
Retrieved chunk textOff (IDs instead)Reproduce a citation dispute

Redaction is a pipeline job, not a per-service habit. The OpenTelemetry Collector receives, processes and exports telemetry, and it is the natural place to strip fields, truncate payloads and route sensitive spans to a shorter-retention store what is OpenTelemetry. Doing redaction centrally also means a sleeping engineer cannot add an unredacted field to a new service at midnight.

Keep the privacy model explainable to your legal team in one sentence: spans carry identifiers and metadata, content capture is opt-in per environment, and any captured content is redacted at the Collector and retained for a short fixed window.

Sampling, cardinality and cost control

You cannot afford to keep every span of every run at full fidelity, and you should not sample uniformly either. The useful rule is tail-based: keep every span of every run that failed, escalated, exceeded a latency threshold, or produced an error, and keep a small random sample of healthy runs for baseline comparison. Since the decision requires seeing the whole trace, this is a Collector-level decision rather than a per-service coin flip.

Sampling is a first-class OpenTelemetry concept, with multiple options documented for deciding which traces to keep OpenTelemetry concepts. The important property for agents is that sampling decisions apply to the whole trace, because a half-kept trace is worse than no trace: it shows a tool call with no retrieval that fed it.

Watch cardinality on attributes. gen_ai.conversation.id, user IDs and session IDs are high-cardinality by design and belong on spans, not on metrics labels. Reserve metrics for the small set that answers "is the agent healthy right now": runs per minute, error rate by tool, p95 run duration, handoff rate by reason, and tokens per run. The four golden signals (latency, traffic, errors, saturation) are a proven minimal set for user-facing services, with the caveat that you must separate the latency of successful and failed requests, because fast failures pull an average down and mask an outage the SRE book. For agents, fast failures are common: a tool that rejects an argument in 5 milliseconds makes the run look quick and wrong.

A worked example of the arithmetic. Suppose you run 200,000 agent runs a day, each producing six spans and 3 KB of attributes with content capture off. That is 1.2 million spans and roughly 3.6 GB of raw attribute data per day. Turning on full prompt and tool-body capture might multiply per-span size by ten or more. Tail sampling that keeps all failed runs (say 4 percent) plus 2 percent of healthy runs cuts the stored span count by roughly 94 percent while retaining every trace you would actually open during an incident.

Putting it together: a checklist for a new agent

Apply the same sequence on any new agent, in this order, and the trace will be usable on day one.

  1. Create the root span with the conversation ID and agent name, and propagate both into every downstream call, including database queries the tools trigger.
  2. Wrap each model call in a chat span carrying the model name, token counts and finish reason.
  3. Wrap each tool in an execute_tool span with name, arguments, result status, truncated body, error type and retry count.
  4. Wrap each search in a retrieval span with the query, index, chunk IDs, ranks and scores plus the score metric name.
  5. Emit a handoff span with an enum reason, a capped summary, the target queue and the assignee.
  6. Redact and truncate at the Collector, and set default content capture to off.
  7. Configure tail sampling: all failures and escalations, plus a small healthy sample.
  8. Build five dashboard panels from the metrics: runs per minute, tool error rate, p95 run duration, handoff rate by reason, tokens per run.

Instrumentation is complete, in the OpenTelemetry sense, when developers no longer need to add more instrumentation to troubleshoot an issue because they already have all the information they need the observability primer. That is a testable bar: pick a real incident from last month and see whether the trace answers the question without a code change. If it does not, one of the eight steps above is missing a field.

Teams that would rather not maintain this plumbing themselves can route every model call through Quanta Inference, which puts text, image, video, audio and embedding models behind one OpenAI-compatible API key with prepaid pricing in US dollars, and keep the tracing decision on their own side of the boundary.

FAQ

FAQ

What is the difference between a log and a span for an agent step?

A log is a timestamped event that stands alone; a span is a unit of work nested inside a trace, carrying a name, timing, structured events and attributes the observability primer. For an agent step you want both: a span so the step joins the rest of the run, and structured key-value fields so the details are queryable as columns.

Should I log the model's full prompt and the tool results?

Not by default. The GenAI conventions capture no prompt content or tool arguments unless you opt in, because they can contain sensitive data OpenTelemetry GenAI observability. Keep metadata on always, store truncated bodies in the span, and put full payloads behind an opt-in with redaction and short retention.

How do I know whether retrieval or the model caused a wrong answer?

Read the retrieval span before the model turn. If the correct chunk is returned with a high score and the answer is still wrong, the model is at fault. If the chunk is missing the query or index is at fault, and if it ranks low the reranking or threshold is at fault.

What is the minimum attribute set for a tool call span?

Tool name, full arguments, result status, raw result or error message, and duration. Add a retry count and a call ID if tools run concurrently Honeycomb. Everything else is refinement.

How should I sample agent traces to keep costs down?

Sample at the trace level, not the span level, and do it in the Collector. Keep every trace that failed, escalated or breached a latency threshold, plus a small random sample of healthy runs for a baseline. A partially kept trace misleads more than it helps, and the volume arithmetic above shows the saving is large.

Sources

Sources

  1. Tracing vs logging for LLM apps: what's the difference and ...
  2. Observability primer - OpenTelemetry
  3. What is OpenTelemetry?
  4. Overview | OpenTelemetry
  5. A Guide to Instrumenting AI Agents for the Agent Timeline
  6. Inside the LLM Call: GenAI Observability with OpenTelemetry
  7. What Is Structured Logging? Benefits and Tips | SigNoz
  8. How OpenTelemetry Traces LLM Calls, Agent Reasoning ...
  9. OpenTelemetry Concepts
  10. Chapter 6 - Monitoring Distributed Systems - Google SRE
About the author

About the author

Antonio Evans
Antonio Evans

Antonio Evans is the founder of Quanta Intelligence and a fractional CTO who builds HIPAA-ready AI systems for health and life-science companies. Before that he was technical co-founder of FriendsEAT for twenty years, CEO of Socialdraft, and a data engineer at IBM. Antonio lives with his dog Santino in Lisbon, Portugal.

All articles