Antonio Evans
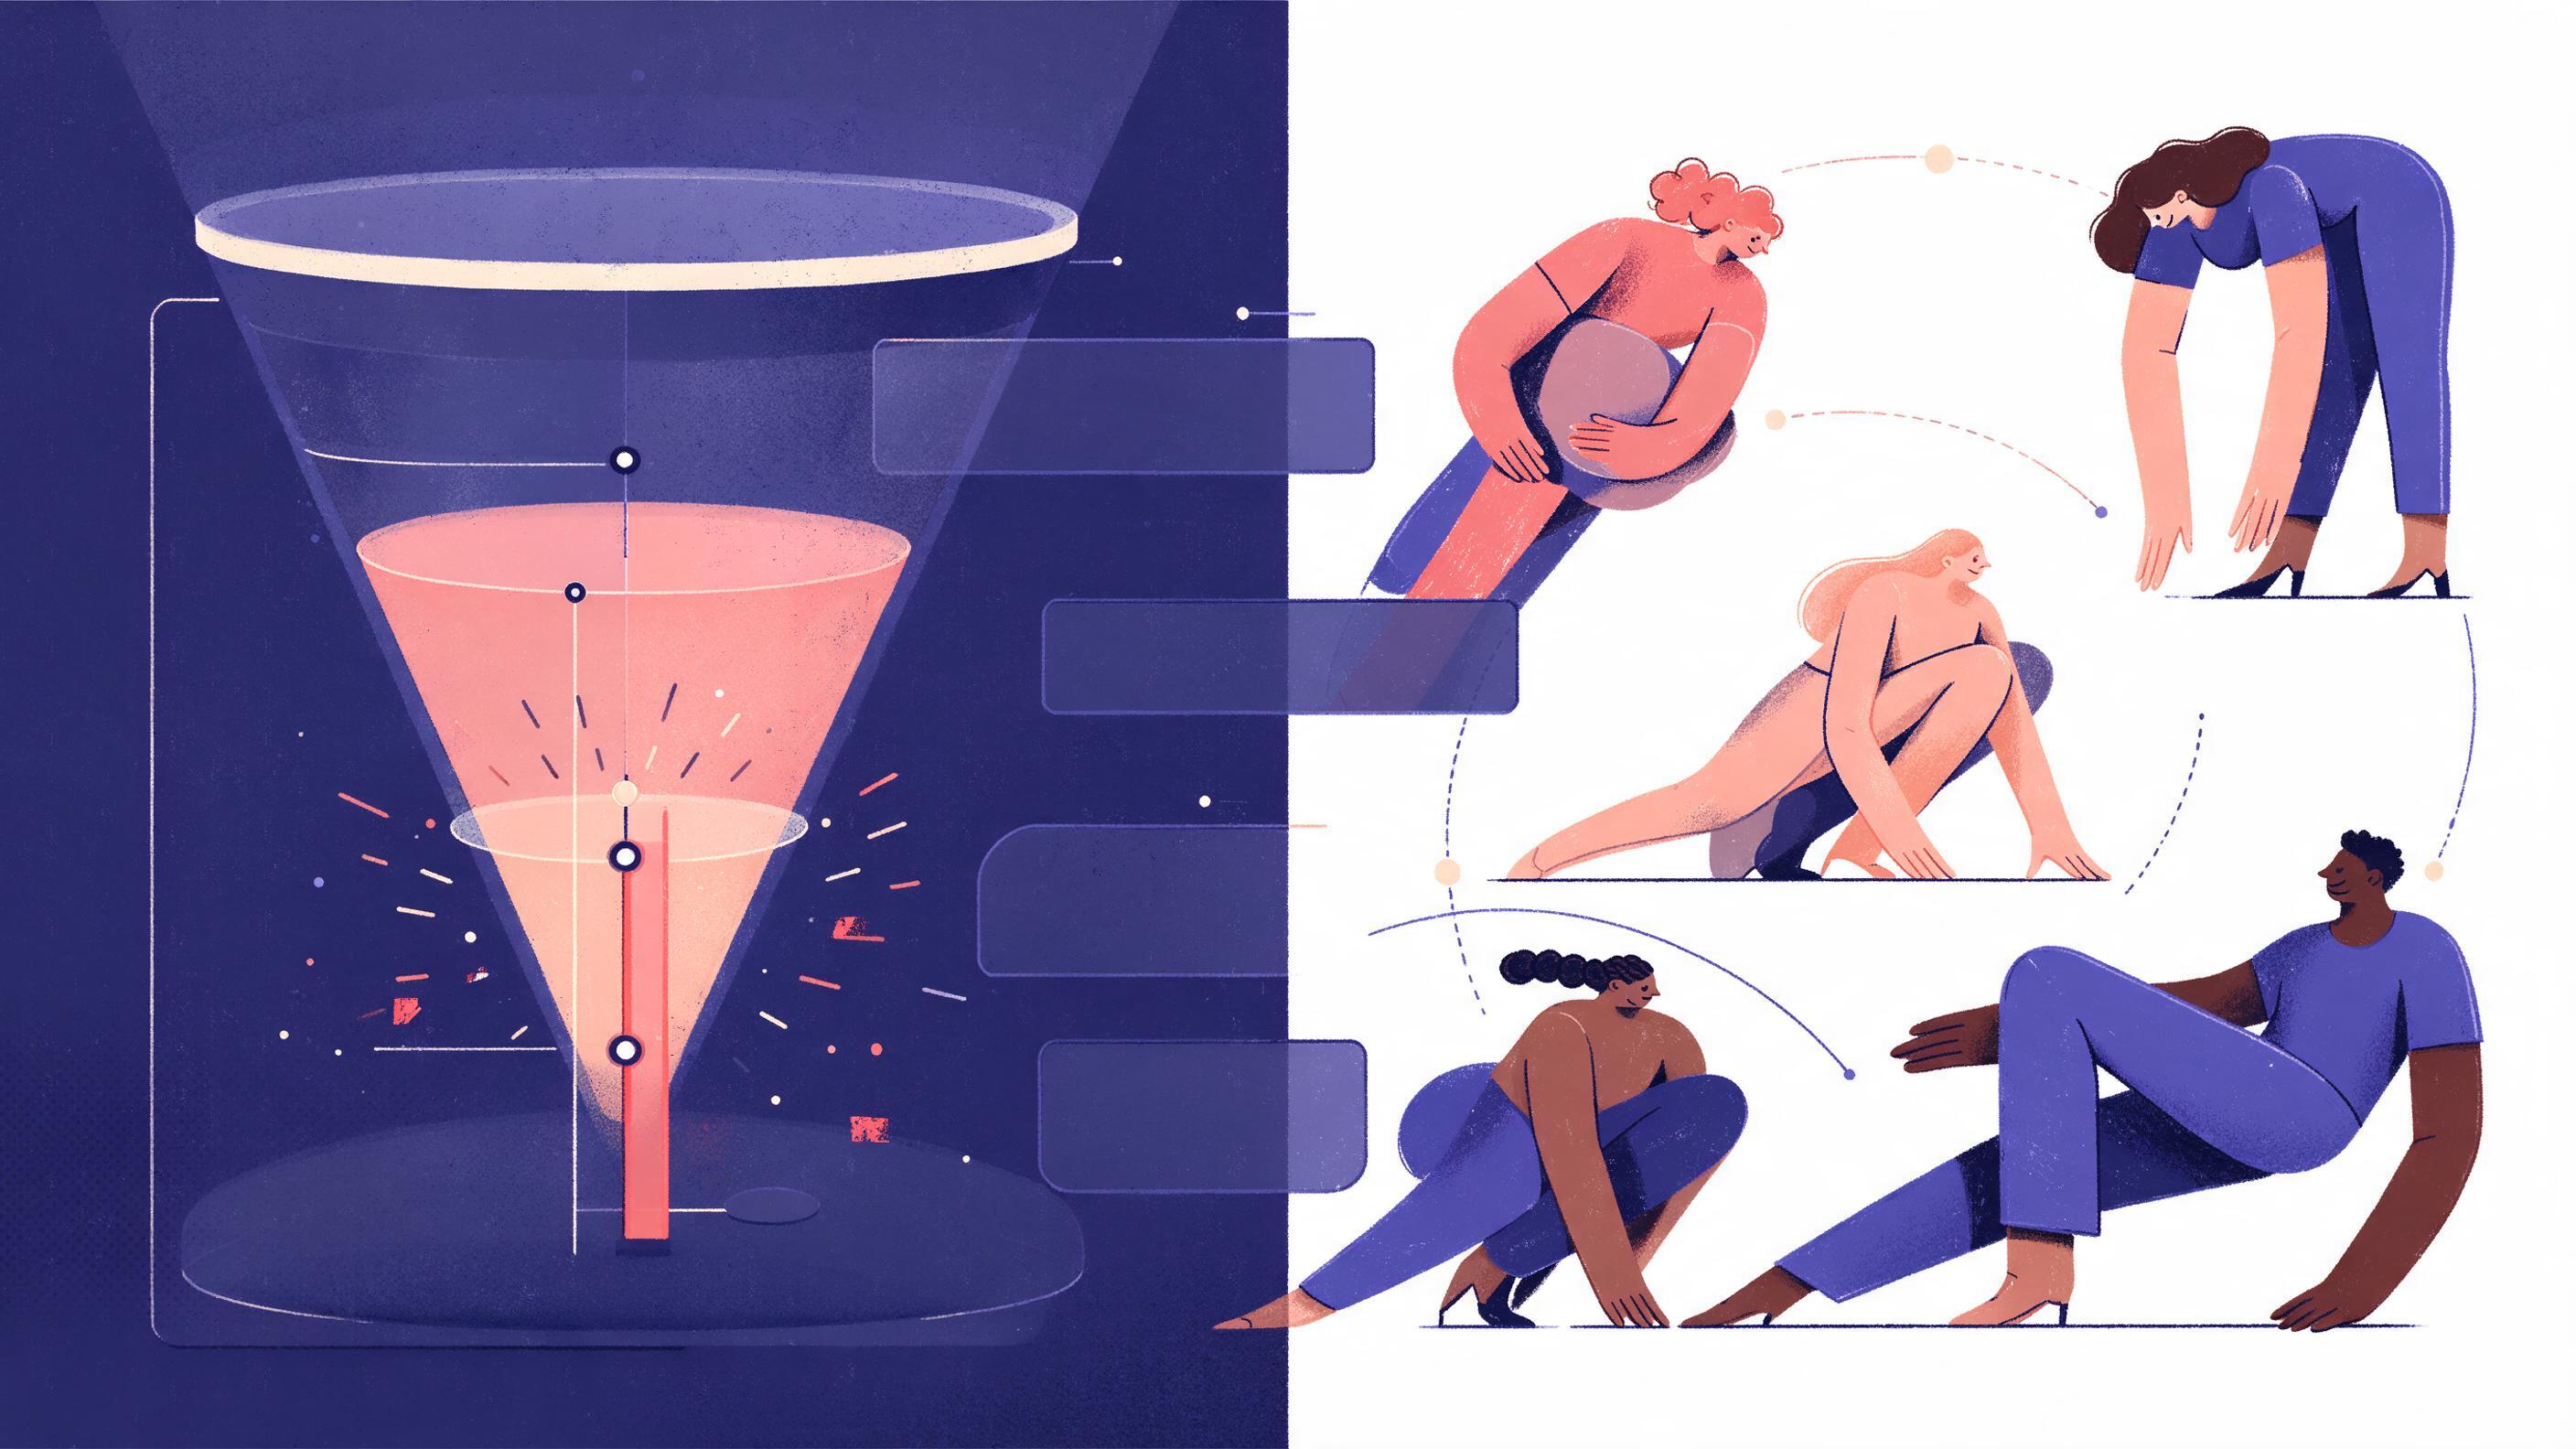
A smoke test is a cheap behavioral probe: you put a promise in front of real traffic and measure whether people act on it before you build the thing. Landing pages, waitlists and fake doors all follow the same logic, and practitioners use them precisely because they are faster and cheaper than building a prototype or a full product as The Good explains in its smoke testing guide. The usual design is a single decision at a fixed sample size: collect N visitors, count the clicks, compare the click rate against a threshold.
The trouble starts when someone looks at the dashboard on day two and wants to call it. Every extra look is another chance for random noise to cross the line. Spotify's engineering team describes this peeking problem plainly: a z-test calibrated to a 5 percent false positive rate, applied repeatedly as data arrives, produces a true false positive rate close to 10 percent after just two looks, and the rate keeps climbing with more checks in Spotify's writeup on choosing a sequential framework. A worked simulation reaches a similar conclusion: when a t-test is applied every 10 observations across 1,000 observations per group under a true null, the observed false positive rate rises to about 30 percent instead of 5 percent in this sequential testing tutorial. Statsig uses a die-rolling analogy for the same effect, noting that daily looks at a 5 percent test can push the chance of at least one false alarm to roughly 30 percent over a week in Statsig's sequential testing post.
None of this means you must run blind to the maximum. It means the looking has to be planned. That is the premise of sequential testing: you can check at pre-agreed points provided the decision boundary at each point is computed for the entire schedule, not for a single isolated test as described in this overview of sequential methods.